Bicorder synthetic data analysis
This directory concerns a synthetic data analysis conducted with the Protocol Bicorder.
Scripts were created with the assistance of Claude Code. Data processing was done largely with either local models or the Ollama cloud service, which does not retain user data. Thanks to Seth Frey (UC Davis) for guidance, but all mistakes are the responsibility of the author, Nathan Schneider. WARNING: This is the work of a researcher working with AI outside their field of expertise and should be treated as a playful experiment, not a model of rigorous methodology.
Purpose
This analyses has several purposes:
- To test the usefulness and limitations of the Protocol Bicorder
- To identify potential improvements to the Protocol Bicorder
- To identify any patterns in a synthetic dataset derived from recent works on protocols
Procedure
Document chunking
This stage gathered raw data from recent protocol-focused texts.
The following prompt was applied to book chapter drafts and major protocol-related books, including the draft of the author's book, The Protocol Reader, As for Protocols, and Das Protokoll. The texts were pasted in plain text and then divided into 5000-word files, with the following prompt applied to each of them with the chunk.sh script:
model: "gemma3:12b"
context: "model running on ollama locally, accessed with llm on the command line"
prompt: "Return csv-formatted data (with no markdown wrapper) that consists of a list of protocols discussed or referred to in the attached text. Protocols are defined extremely broadly as 'patterns of interaction,' and may be of a nontechnical nature. Protocols should be as specific as possible, such as 'Sacrament of Reconciliation' rather than 'Religious Protocols.' The first column should provide a brief descriptor of the protocol, and the second column should describe it in a substantial paragraph of 3-5 sentences, encapsulated in quotation marks to avoid breaking on commas. Be sure to paraphrase rather than quoting directly from the source text."
The result was a CSV-formatted list of protocols (protocols_raw.csv, n=774 total protocols listed).
Dataset cleaning
The dataset was then manually reviewed. The review involved the following:
- Removal of repetitive formatting material introduced by the LLM
- Correction or removal of formatting errors
- Removal of rows whose contents met the following criteria:
- Repetition of entries---though some repetitions were simply merged into a single entry
- Overly broad entries that lacked meaningful context-specificity
- Overly narrow entries, e.g., referring to specific events
The cleaning process was carried out in a subjective manner, so some entries that meet the above criteria may remain in the dataset. The dataset also appears to include some LLM hallucinations---that is, protocols not in the texts---but the hallucinations are often acceptable examples and so some have been retained. Some degree of noise in the dataset was considered acceptable for the purposes of the study. Some degree of repetition, also, provides the dataset with a kind of control cases for evaluating the diagnostic process.
The result was a CSV-formatted list of protocols (protocols_edited.csv, n=411).
Initial diagnostic
This diagnostic used the file now at bicorder_analyzed.json, though the scripts are set up to analyze ../bicorder.json. That file has since been updated based on this analysis.
For each row in the dataset, and on each gradient, a series of scripts prompts the LLM to apply each gradient to the protocol. The outputs are then added to a CSV output file.
The result was a CSV-formatted list of protocols (diagnostic_output.csv, n=411).
See detailed documentation of the scripts at WORKFLOW.md.
Manual and alternate model audit
To test the output, a manual review of the first 10 protocols in the protocols_edited.csv dataset was produced in the file diagnostic_output_manual.csv. (Alphabetization in this case seems a reasonable proxy for a random sample of protocols. It includes some partially overlapping protocols, as does the dataset as a whole.) Additionally, three models were tested on the same cases:
python3 bicorder_batch.py protocols_edited.csv -o diagnostic_output_mistral.csv -m mistral -a "Mistral" -s "A careful ethnographer and outsider aspiring to achieve a neutral stance and a high degree of precision" --start 1 --end 10
python3 bicorder_batch.py protocols_edited.csv -o diagnostic_output_gpt-oss.csv -m gpt-oss -a "GPT-OSS" -s "A careful ethnographer and outsider aspiring to achieve a neutral stance and a high degree of precision" --start 1 --end 10
python3 bicorder_batch.py protocols_edited.csv -o diagnostic_output_gemma3-12b.csv -m gemma3:12b -a "Gemma3:12b" -s "A careful ethnographer and outsider aspiring to achieve a neutral stance and a high degree of precision" --start 1 --end 10
A Euclidean distance analysis (./venv/bin/python3 compare analyses.py) found that the gpt-oss model was closer to the manual example than the others. It was therefore selected to be the model used for conducting the bicorder diagnostic on the dataset.
Average Euclidean Distance:
  1. diagnostic_output_gpt-oss.csv    - Avg Distance: 11.68
  2. diagnostic_output_gemma3-12b.csv - Avg Distance: 13.06
  3. diagnostic_output_mistral.csv    - Avg Distance: 13.33
Command used to produce diagnostic_output.csv (using the Ollama cloud service for the gpt-oss model):
python3 bicorder_batch.py protocols_edited.csv -o diagnostic_output.csv -m gpt-oss:20b-cloud -a "GPT-OSS" -s "A careful ethnographer and outsider aspiring to achieve a neutral stance and a high degree of precision"
The result was a CSV-formatted list of protocols (diagnostic_output.csv, n=411).
Further analysis
Basic averages
Per-protocol values are meaningful for the bicorder because, despite varying levels of appropriateness, all of the gradients are structured as ranging from "hardness" to "softness"---with lower values associated with greater rigidity. The average value for a given protocol, therefore, provides a rough sense of the protocol's hardness.
Basic averages appear in diagnostic_output-analysis.ods.
Univariate analysis
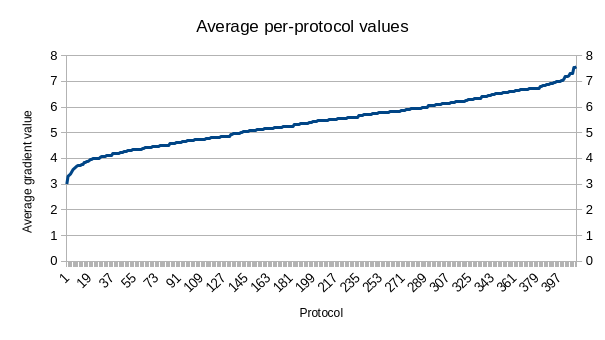
First, a plot of average values for each protocol:
This reveals a linear distribution of values among the protocols, aside from exponential curves only at the extremes. Perhaps the most interesting finding is a skew toward the higher end of the scale, associated with softness. Even relatively hard, technical protocols appear to have significant soft characteristics.
The protocol value averages have a mean of 5.45 and a median of 5.48. In comparison to the midpoint of 5, the normalized midpoint deviation is 0.11. In comparison, the Pearson coefficient measures the skew at just -0.07, which means that the relative skew of the data is actually slightly downward. So the distribution of protocol values is very balanced but has a consistent upward deviation from the scale's baseline. (These calculations are in diagnostic_output-analysis.odt[averages].)
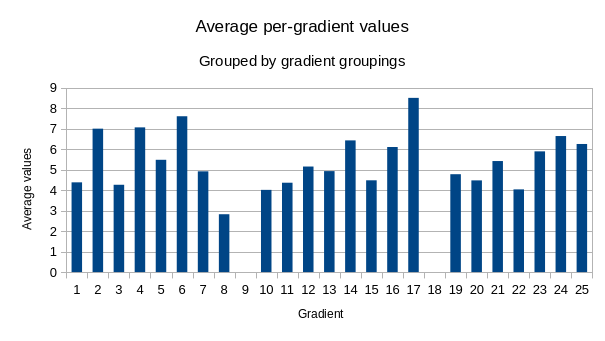
Second, a plot of average values for each gradient (with gaps to indicate the three groupings of gradients):
This indicates that a few of the gradients appear to have outsized responsibility for the high skew of the protocol averages.
Entanglement_exclusive_vs_non-exclusiveis the highest by nearly a full point- Three others have averages over 7:
Design_precise_vs_interpretiveDesign_documenting_vs_enablingDesign_technical_vs_social
There is also an extreme at the bottom end: Design_durable_vs_ephemeral is the lowest by a full point.
It is not clear whether these extremes reveal anything other than a bias in the dataset or the LLM interpreter. Their descriptions may contribute to the extremes.
Multivariate analysis
Expectations:
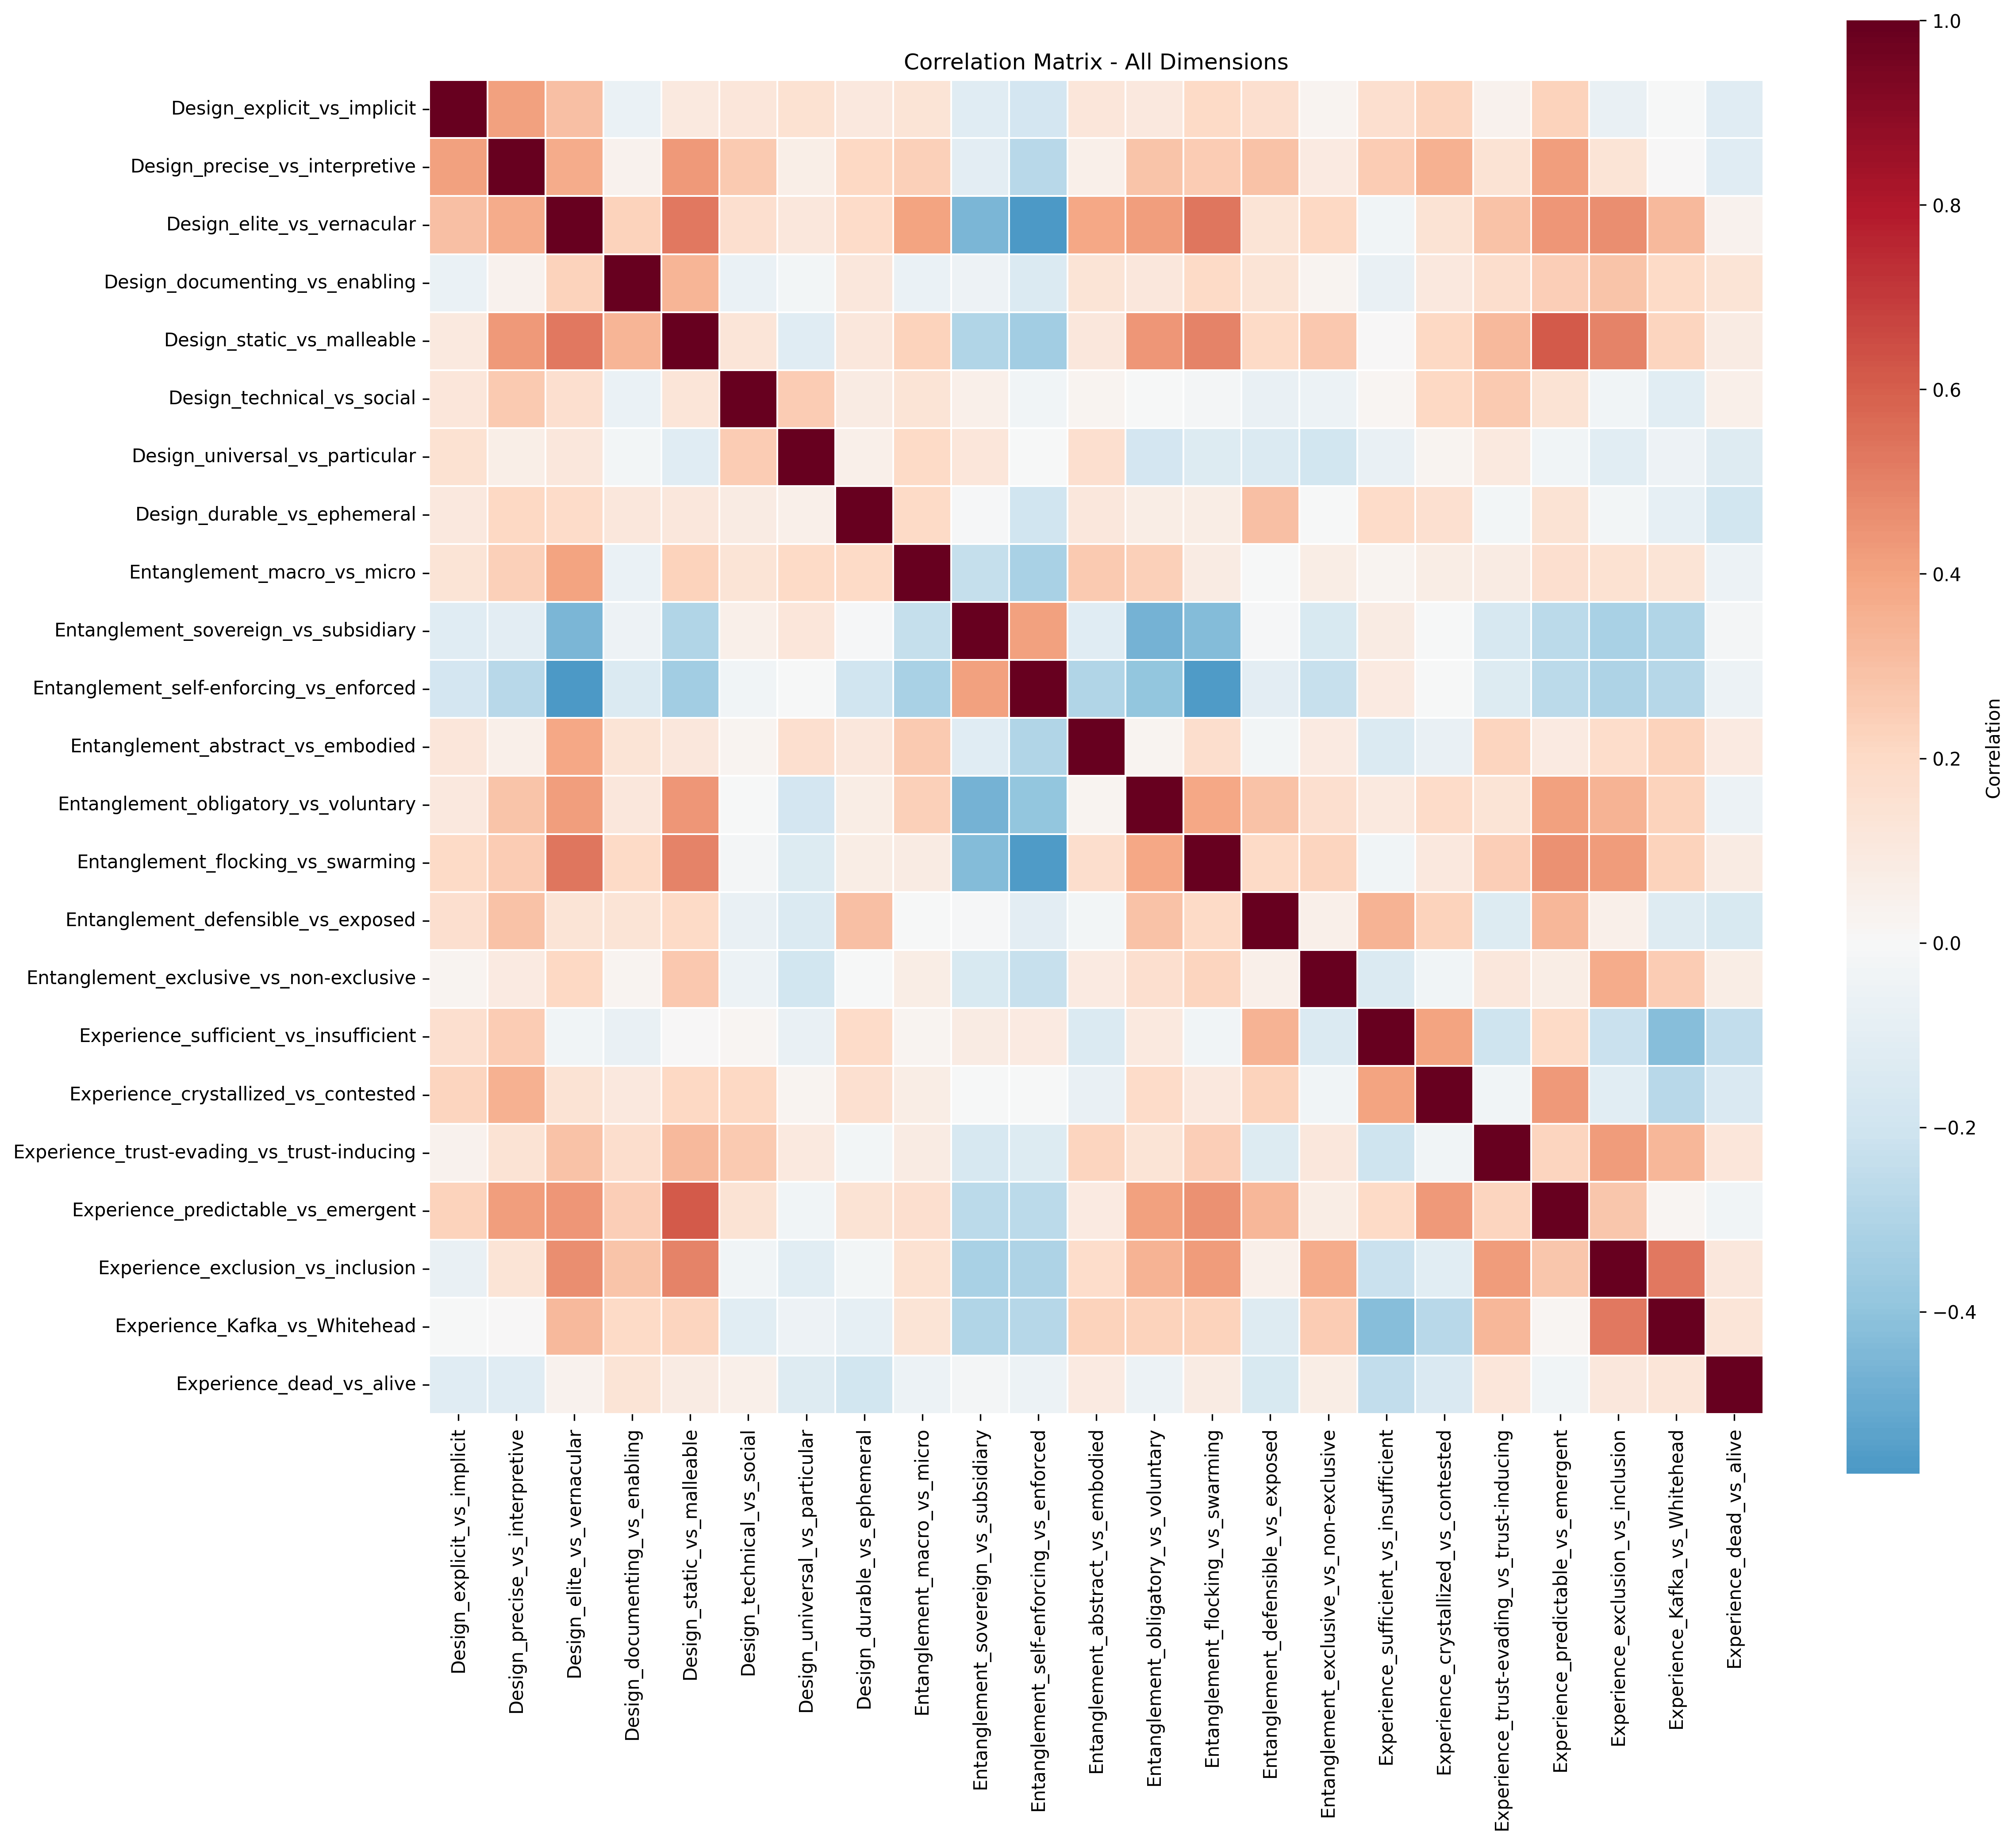
- There are some gradients whose values are highly correlated. These might point to redundancies in the bicorder design.
- Some correlations might be revealing about connections in the characteristics of protocols, but these should be considered carefully as they may be the result of design or LLM interpretation.
Claude Code created a multivariate_analysis.py tool to conduct this analysis. Usage:
# Run all analyses (default)
venv/bin/python3 multivariate_analysis.py diagnostic_output.csv

# Run specific analyses only
venv/bin/python3 multivariate_analysis.py diagnostic_output.csv --analyses
clustering pca
Initial manual observations:
- The correlations generally seem predictable; for example, the strongest is between
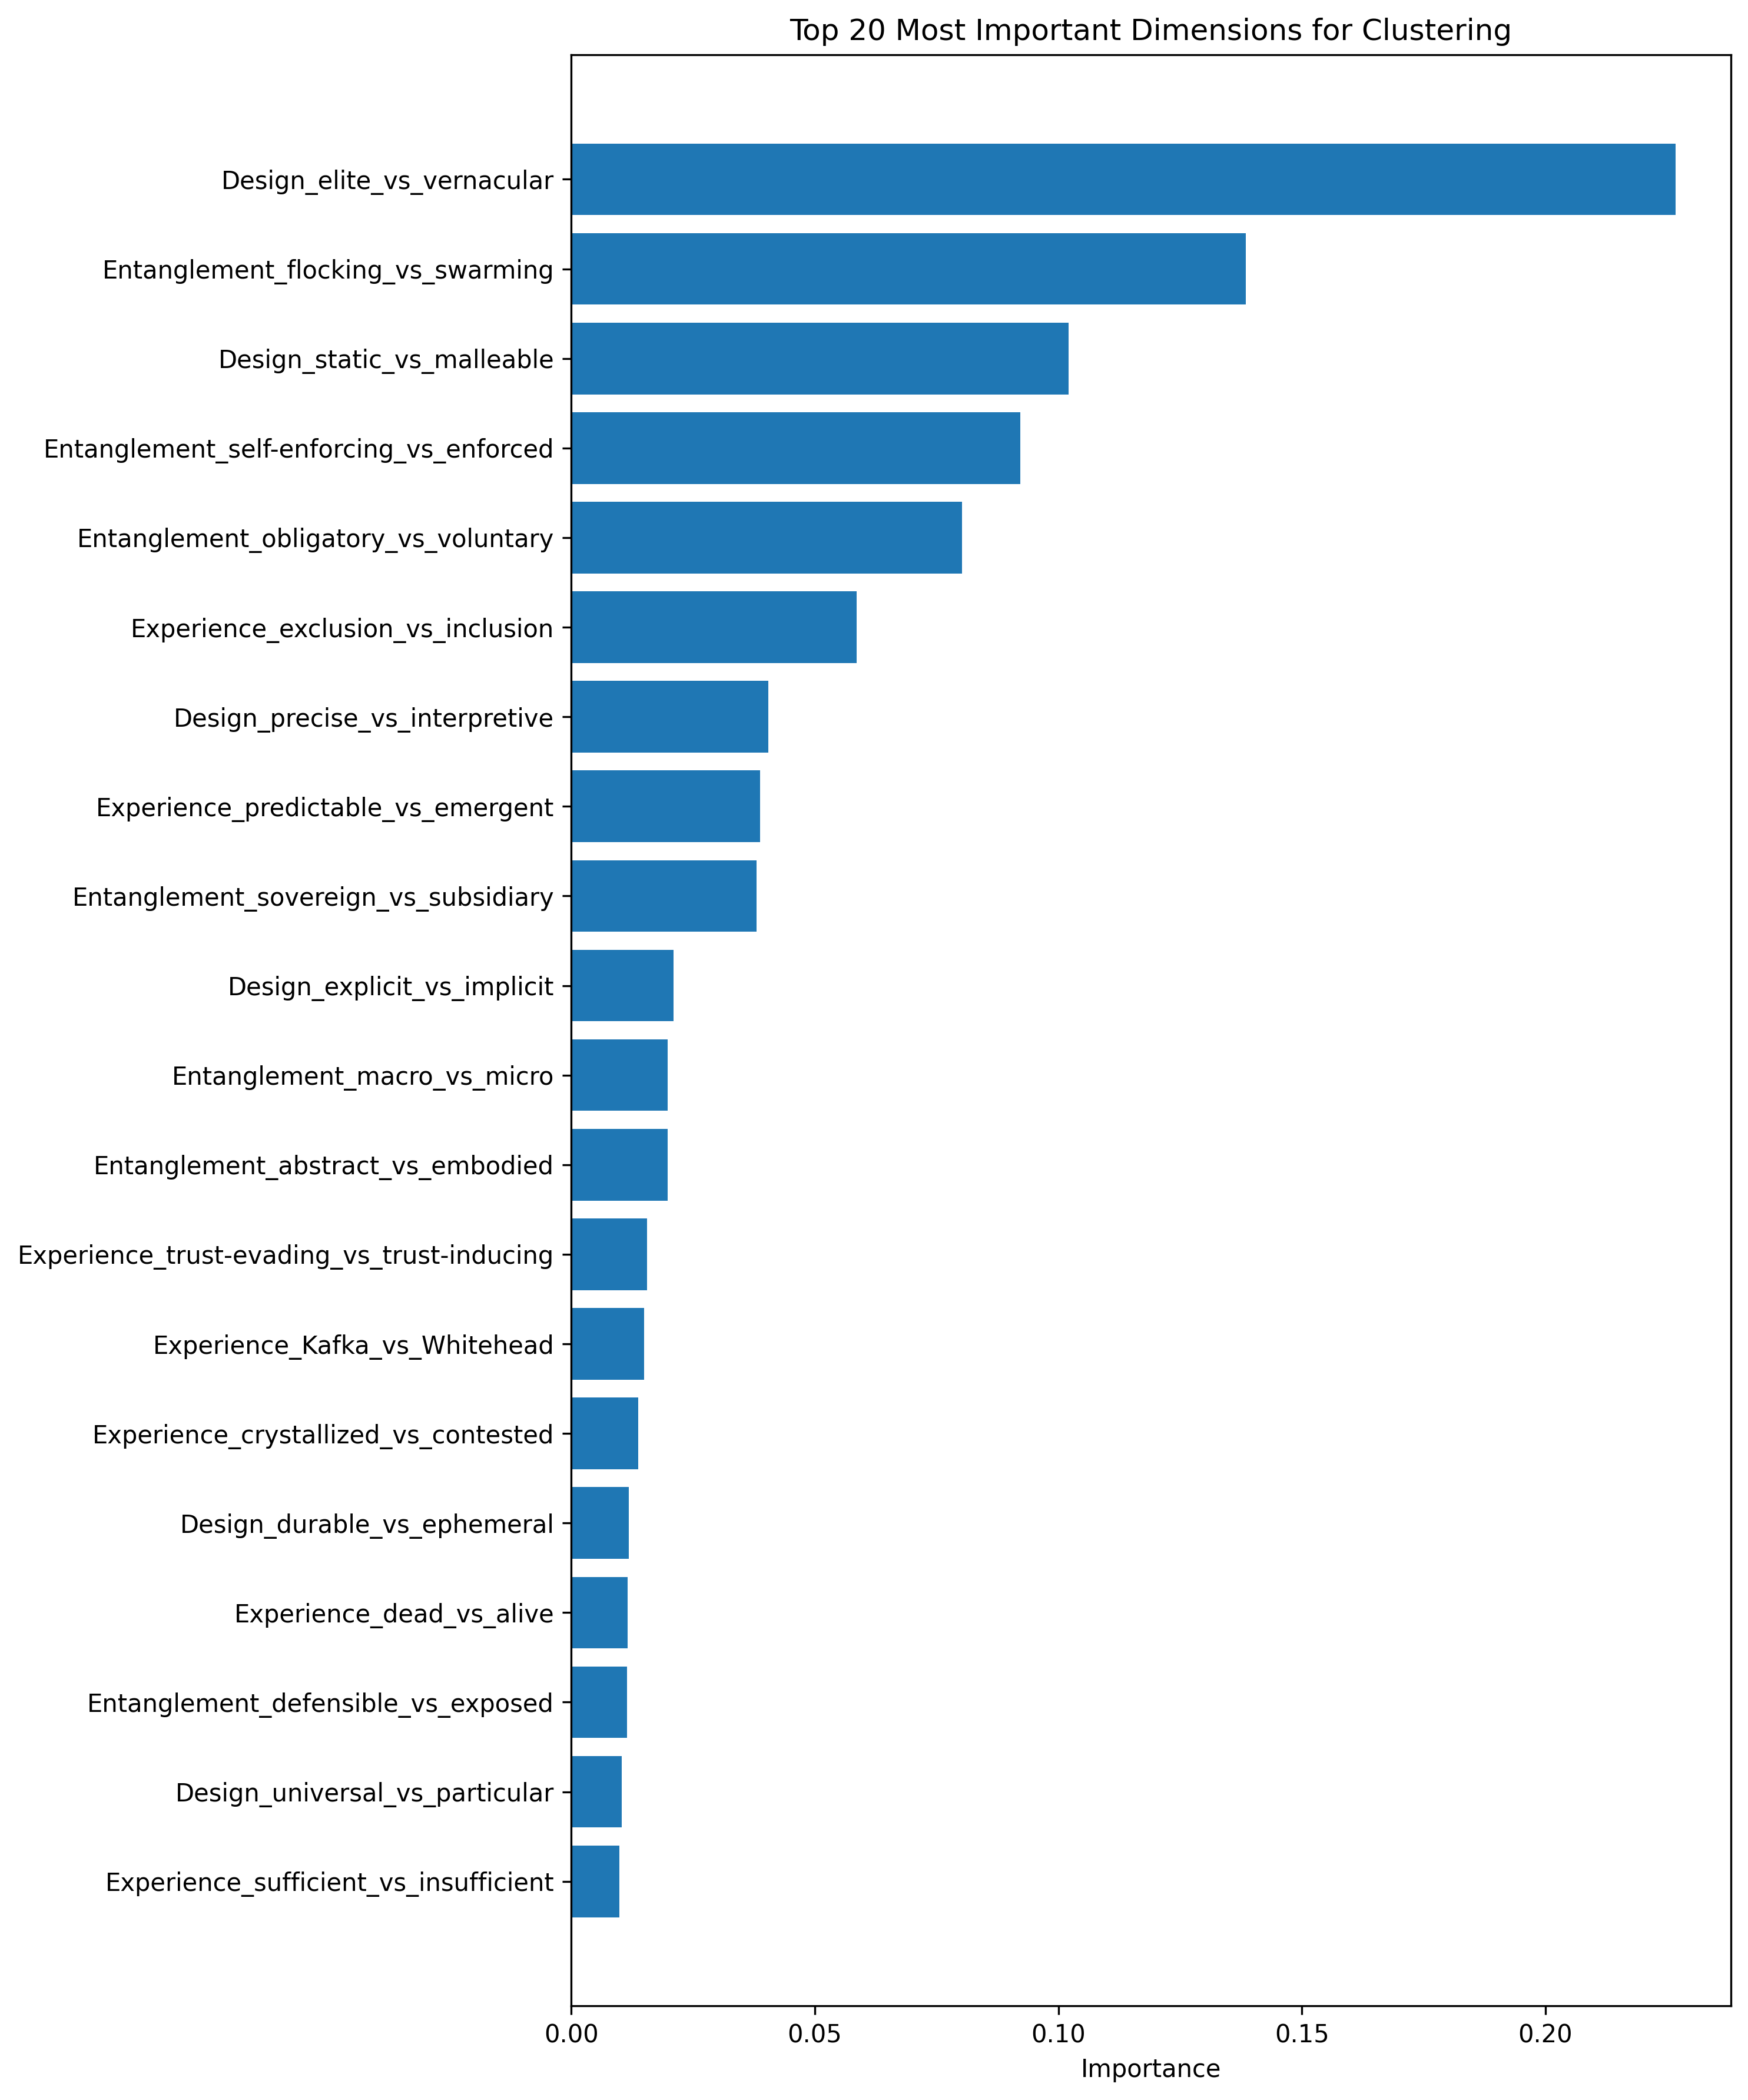
Design_static_vs_malleableandExperience_predictable_vs_emergent, which is not surprising - The elite vs. vernacular distinction appears to be the most predictive gradient (
analysis_results/plots/feature_importances.png)
Claude's interpretation:
- Two Fundamental Protocol Types (K-Means Clustering)
The data reveals two distinct protocol families (216 vs 192 protocols):
Cluster 1: "Vernacular/Emergent Protocols"
- Examples: Marronage, Songlines, Access-Centered Practices, Ethereum Proof of Work, Sangoma Healing Practices
- Characteristics:
- HIGH: elite→vernacular (6.4), malleable (7.3), flocking→swarming (6.4)
- LOW: self-enforcing→enforced (3.4), sovereign→subsidiary (2.9)
Cluster 2: "Institutional/Standardized Protocols"
- Examples: ISO standards, Greenwich Mean Time, Building Codes, German Bureaucratic Prose, Royal Access Protocol
- Characteristics:
- HIGH: self-enforcing (7.1), sovereign (6.0)
- LOW: elite→vernacular (1.8), flocking→swarming (2.3), static (3.5)
- Key Structural Dimensions (PCA)
Three principal components explain 55% of variance:
PC1 (main axis of variation): Elite/Static/Flocking ↔ Self-enforcing
- Essentially captures the Vernacular vs. Institutional divide
PC2: Sufficient/Crystallized ↔ Kafka-esque
- Measures protocol "completeness" vs. bureaucratic nightmare quality
PC3: Universal/Technical/Macro ↔ Particular/Embodied
- Scale and abstraction level
Strong Correlations (Most Significant Relationships)
Static ↔ Predictable (r=0.61): Unchanging protocols create predictable experiences
Elite ↔ Self-enforcing (r=-0.58): Elite protocols need external enforcement; vernacular ones self-enforce
Self-enforcing ↔ Flocking (r=-0.56): Self-enforcing protocols resist swarming dynamics
Exclusion ↔ Kafka (r=0.52): Exclusionary protocols feel Kafka-esque
Most Discriminative Dimension (Feature Importance)
Design_elite_vs_vernacular (22.7% importance) is by far the most powerful predictor of protocol type, followed by Entanglement_flocking_vs_swarming (13.8%).
- Most "Central" Protocols (Network Analysis)
These protocols share the most dimensional similarities with others:
VPN Usage (Circumvention Protocol) - bridges many protocol types
Access Check-in - connects accessibility and participation patterns
Quadratic Voting - spans governance dimensions
Outliers (DBSCAN found 281!)
Most protocols are actually quite unique - DBSCAN identified 281 outliers, suggesting the dataset contains many distinctive protocol configurations that don't fit neat clusters. Only 10 tight sub-clusters exist.
- Category Prediction Power
- Design dimensions predict clustering with 90.4% accuracy
- Entanglement dimensions: 89.2% accuracy
- Experience dimensions: only 78.3% accuracy
This suggests Design and Entanglement are more fundamental than Experience.
The core insight: Protocols fundamentally divide between vernacular/emergent/malleable forms and institutional/standardized/static forms, with the elite↔vernacular dimension being the strongest predictor of all other characteristics.
Comments:
- The distinction along the lines of "Vernacular/Emergent" and "Institutional/Standardized" tracks well with
- Strange that "Ethereum Proof of Work" appears in the "Vernacular/Emergent" family
Conclusions
Improvements to the bicorder
These findings indicate some options for improving on the current version of the bicorder.
Reflections on manual review:
- The exclusion/exclusive names could be improved to overlap less
- Should have separate values for "n/a" (0---but that could screw up averages) and both (5)
- Remove the analysis section, or use analyses here for what becomes most meaningful
Claude report on possible improvements:
- Prioritize High-Impact Dimensions ⭐
The current 23 dimensions aren't equally informative. Reorder by importance:
Tier 1 - Critical (>10% importance):
- Design_elite_vs_vernacular (22.7%) - THE most discriminative dimension
- Entanglement_flocking_vs_swarming (13.8%)
- Design_static_vs_malleable (10.2%)
Tier 2 - Important (5-10%):
- Entanglement_self-enforcing_vs_enforced (9.2%)
- Entanglement_obligatory_vs_voluntary (8.0%)
- Experience_exclusion_vs_inclusion (5.9%)
Tier 3 - Supplementary (<5%):
- All remaining 17 dimensions
Recommendation: Reorganize the tool to present Tier 1 dimensions first, or mark them as "core diagnostics" vs. "supplementary diagnostics."
- Consider Reducing Low-Value Dimensions
Several dimensions have low discriminative power AND low variance:
Candidates for removal/consolidation:
- Entanglement_exclusive_vs_non-exclusive (0.6% importance, σ=1.64, mean=8.5)
- Responses heavily cluster at "non-exclusive" - not discriminating
- Design_durable_vs_ephemeral (1.2% importance, σ=2.41)
- Entanglement_defensible_vs_exposed (1.1% importance, σ=2.41)
Recommendation: Either remove these or combine into composite measures. Going from 23→18 dimensions would reduce analyst burden by ~20% with minimal information loss.
- Add Composite Scores 📊
Since PC1 explains the main variance, create derived metrics:
"Protocol Type Score" (based on PC1 loadings): Score = elite_vs_vernacular(0.36) + static_vs_malleable(0.33) + flocking_vs_swarming(0.31) - self-enforcing_vs_enforced(0.29)
- High score = Institutional/Standardized
- Low score = Vernacular/Emergent
"Protocol Completeness Score" (based on PC2): Score = sufficient_vs_insufficient(0.43) + crystallized_vs_contested(0.38) - Kafka_vs_Whitehead(0.36)
- Measures how "finished" vs. "kafkaesque" a protocol feels
Recommendation: Display these composite scores alongside individual dimensions to provide quick high-level insights.
- Highlight Key Correlations 🔗
The tool should alert analysts to important relationships:
Strong positive correlations:
- Static ↔ Predictable (0.61)
- Elite ↔ Static (0.53)
- Exclusion ↔ Kafka (0.52)
Strong negative correlations:
- Elite ↔ Self-enforcing (-0.58)
- Self-enforcing ↔ Flocking (-0.56)
Recommendation: When an analyst rates a dimension, show a tooltip: "Protocols rated as 'elite' tend to also be 'static' and require 'enforcement'"
- Flag Potential Redundancy
Two dimension pairs show moderate correlation within the same category:
- Entanglement_abstract_vs_embodied ↔ Entanglement_flocking_vs_swarming (r=-0.56)
- Design_documenting_vs_enabling ↔ Design_static_vs_malleable (r=0.53)
Recommendation: Consider merging these or making one primary and the other optional.
- Rebalance Categories ⚖️
Current split: Design (8), Entanglement (8), Experience (7)
Performance by category:
- Design: 90.4% predictive accuracy
- Entanglement: 89.2% predictive accuracy
- Experience: 78.3% predictive accuracy
Recommendation:
- Strengthen Design (add 1-2 high-variance dimensions)
- Trim Experience (remove low-performers, down to 5)
- Result: 9 Design, 8 Entanglement, 5 Experience = 22 dimensions (down from
- Add Diagnostic Quality Indicators
Based on variance analysis, flag dimensions where responses are too clustered:
- Entanglement_exclusive_vs_non-exclusive: 93% of protocols rate 7-9
- Design_technical_vs_social: Mean=7.6, heavily skewed toward "social"
Recommendation: Consider revising these gradient definitions or endpoints to achieve better distribution.
- Create Shortened Version 🎯
For rapid assessment, create a "Bicorder Core" with just the top 8 dimensions:
- elite_vs_vernacular ⭐⭐⭐
- flocking_vs_swarming
- static_vs_malleable
- self-enforcing_vs_enforced
- obligatory_vs_voluntary
- exclusion_vs_inclusion
- universal_vs_particular (high variance)
- explicit_vs_implicit (high variance)
This captures ~65% of the discriminative power in 1/3 the time.
- Add Comparison Features
The network analysis shows some protocols are highly "central" (similar to many others):
- VPN Usage (Circumvention Protocol)
- Access Check-in
- Quadratic Voting
Recommendation: After rating a protocol, show: "This protocol is most similar to: [X, Y, Z]" based on dimensional proximity.
Summary of Recommendations
Immediate actions:
- ✂️ Remove 3-5 low-value dimensions → 20 dimensions
- 🔄 Reorder dimensions by importance (elite_vs_vernacular first)
- ➕ Add 2 composite scores (Protocol Type, Completeness)
Medium-term enhancements: 4. 🎯 Create "Bicorder Core" (8-dimension quick version) 5. 💡 Add contextual tooltips about correlations 6. 📊 Show similar protocols after assessment
This would make the tool ~20% faster to use while maintaining 95%+ of its discriminative power.
Questions:
- What makes the elite/vernacular distinction so "important"? Is it because of some salience of the description?
- Why is the sovereign/subsidiary distinction, which is such a central part of the theorizing here, not more "important"? Would this change with a different description of the values?
Future work: Description modification
Hypothesis: The phrasing of gradient value descriptions could have a significant impact on the salience of particular gradients.
Method: Modify the descriptions and run the same tests, see if the results are different.
Future work: Persona elaboration
Hypothesis: Changing the analyst and their standpoint could result in interesting differences of outcomes.
Method: Alongside the dataset of protocols, generate diverse personas, such as a) personas used to evaluate every protocols, and b) protocol-specific personas that reflect different relationships to the protocol. Modify the test suite to include personas as an additional dimension of the analysis.
Integration with Bicorder Tool
The cluster analysis findings have been integrated into the bicorder system as an automated analysis gradient:
Bureaucratic ↔ Relational - A new analysis field that automatically calculates where a protocol falls on the spectrum between the two protocol families identified through clustering analysis.
Implementation
- Model: Linear Discriminant Analysis (LDA) trained on 406 protocols
- Input: The 23 diagnostic dimension values (read from bicorder.json in gradient order)
- Output: A value from 1-9 where:
- 1-3: Strongly bureaucratic/institutional (formal, top-down, externally enforced)
- 4-6: Mixed or boundary characteristics
- 7-9: Strongly relational/cultural (emergent, voluntary, community-based)
Design philosophy: The model includes a bicorder_version field matching the bicorder.json version it was trained on. The implementation checks versions match before calculating. When bicorder.json structure changes (gradients added/removed/reordered), increment the version and retrain the model.
This simple version-matching approach ensures compatibility without complex structure mapping.
Files
bicorder_model.json(5KB) - Trained LDA model with coefficients and scaler parametersbicorder-classifier.js- JavaScript implementation for real-time classification in web appascii_bicorder.py(updated) - Python script now calculates automated analysis values../bicorder.json(updated) - Added bureaucratic ↔ relational gradient to analysis section
Usage
The calculation happens automatically when generating bicorder output:
python3 ascii_bicorder.py bicorder.json bicorder.txt
For web integration, see INTEGRATION_GUIDE.md for details on using bicorder-classifier.js to provide real-time classification as users fill out diagnostics.
Key Features
- Automated: Calculated from diagnostic values, no manual assessment needed
- Data-driven: Based on multivariate analysis of 406 protocols
- Single metric: Distance to boundary determines classification confidence
- Form recommendation: Can suggest short vs. long form based on boundary distance
- Lightweight: 5KB model, no dependencies, runs client-side
The integration provides a data-backed way to understand where a protocol sits on the fundamental institutional/relational spectrum identified in the clustering analysis.


